


As I mentioned before, SQL Operations Studio is my new favorite SQL digging tool for queries. It loads fast, is portable, and, most of all, has user-configurable widgets.
Let’s dive into a create some custom widgets!
If you haven’t already, be sure to pick up SQL Operations Studio. The zip works great tossed into my tools directory that I sync across devices with Dropbox.
Configuring Your Settings
Out of the box, you’ll need to add your own custom dashboard.database.widgets section into your user settings.
- Go to
File > Preferences > Settingsto open the User Settings editor. - Create your widgets placeholder by typing “dashboard.database.widgets” and letting the auto-complete fill in the default values.
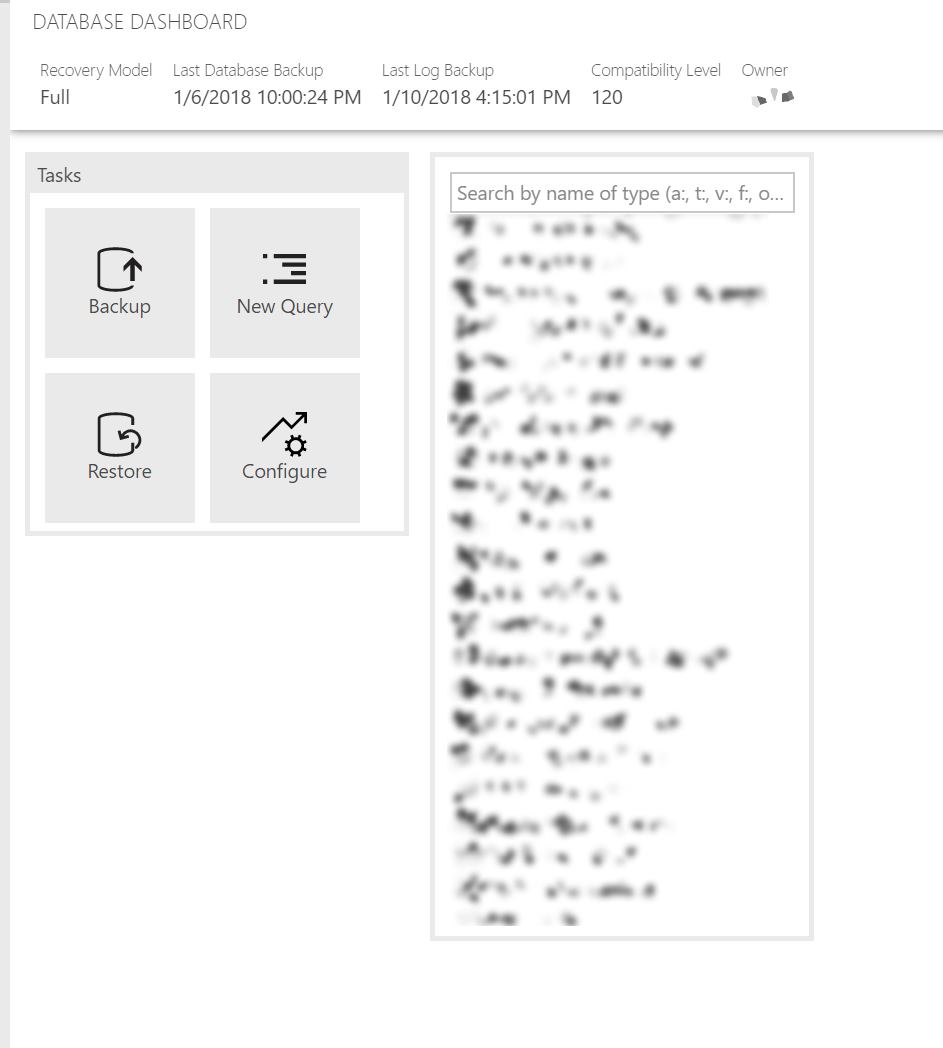
You’ll have a new array that looks similar to what’s below that includes two widgets, a Task widget and a list of your database tables.
"dashboard.database.widgets": [
    {
        "name": "Tasks",
        "gridItemConfig": {
            "sizex": 1,
            "sizey": 1
        },
        "widget": {
            "tasks-widget": {}
        }
    },
    {
        "gridItemConfig": {
            "sizex": 1,
            "sizey": 2
        },
        "widget": {
            "explorer-widget": {}
        }
    }
]
Save your settings and right-click your database in the Servers list and click Manage to refresh the dashboard. You’ll see your two widgets.
Creating a Widget Query
You’ll need a location on your system to store the queries. Since I’m using the portable version, I’ve simply created a widgets directory inside it so that they always sync.
Inside this directory, create a new .sql file containing what you want your widget to display. Let’s start with as simple query that reports back the server properties of your database.
SELECT
SERVERPROPERTY('Edition') AS [Edition],
SERVERPROPERTY('ProductLevel') AS [ProductLevel],
SERVERPROPERTY('ProductVersion') AS [ProductVersion],
SERVERPROPERTY('ProductMajorVersion') AS [ProductMajorVersion],
SERVERPROPERTY('ProductMinorVersion') AS [ProductMinorVersion],
SERVERPROPERTY('BuildClrVersion') AS [Build CLR Version],
SERVERPROPERTY('ProductBuild') AS [ProductBuild],
SERVERPROPERTY('ProductUpdateReference') AS [ProductUpdateReference],
SERVERPROPERTY('IsFullTextInstalled') AS [IsFullTextInstalled],
SERVERPROPERTY('IsIntegratedSecurityOnly') AS [IsIntegratedSecurityOnly],
SERVERPROPERTY('FilestreamConfiguredLevel') AS [FilestreamConfiguredLevel],
SERVERPROPERTY('IsXTPSupported') AS [IsXTPSupported],
SERVERPROPERTY('IsPolybaseInstalled') AS [IsPolybaseInstalled],
SERVERPROPERTY('IsAdvancedAnalyticsInstalled') AS [IsRServicesInstalled];
(borrowed and modified from Glenn Berry)
Once that file is saved, return to your User Settings and add a new section in your dashboard.database.widgets.
{
    "name": "Server Properties",
    "gridItemConfig": {
        "sizex": 2,
        "sizey": 2
    },
    "widget": {
        "insights-widget": {
            "queryFile": "e:/dropbox/sql/widgets/server_properties.sql",
            "type": {
                "count": null
            }
        }
    }
}| property | purpose |
|---|---|
name | The title of the widget |
gridItemConfig | sizex and sizey specify the dimensions of the widget on the dashboard. Increase x for wider widgets and y for taller widgets. |
widget | The actual widget configuration |
insights-widget | An insights-widget is a widget powered by a custom, external query file. This will be the primary widget type you’ll use. |
queryFile | The full path to the SQL file containing your widget query |
type | The type of widget to create. count uses the labels and first row of data to provide a list of information; it has no options and is the most simplistic widget. There’s also bar, horizontalBar, doughnut, line, pie, scatter, and timeSeries. Each have their own configurable options. |
Save your User Settings and refresh your dashboard (right-click your database, click Manage).
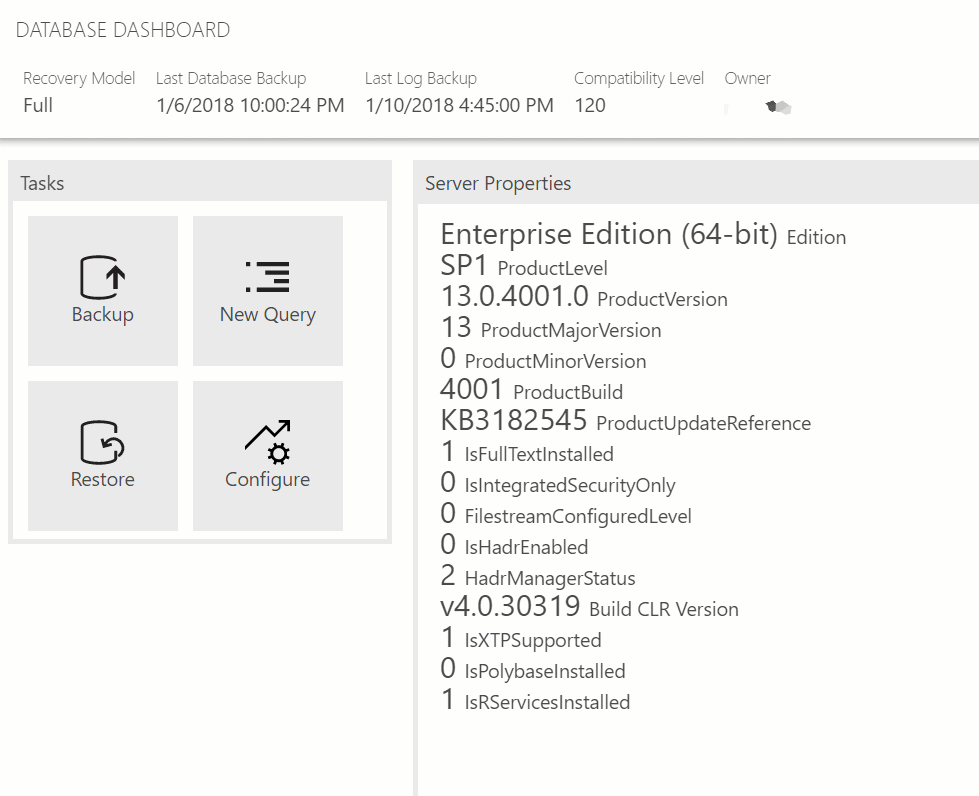
Fancy, right? Using widgets, you can take those informational and diagnostic queries you normally run and turn them into at-a-glance widgets right when you open up your tools.
More to come!
That’s it for now. Next time, we’ll dig into our own custom bar charts to help diagnose issues in your database and even some custom charts based on your own data and KPIs!