


Now that the initial configuration is taken care of (see part 1), the real interesting stuff awaits in part 2.
Now, let’s take a look at creating graphs for system and performance data to help you diagnose your database and server’s performance. In addition to system information, we’ll dig into creating custom widgets based on your database data so you can build out a KPI dashboard.
The text widget output is nice, but it’s a real step up to be able to see a quick visualization. Let’s look at two different types of database metric visualizations. The first is using the built-in data reports and the second is using a custom query.
Building a database metric quick visualization
SQL Operations Studio provides several built-in widgets. Everything from the insights widgets we’ve been using to reports on table size and backup history.
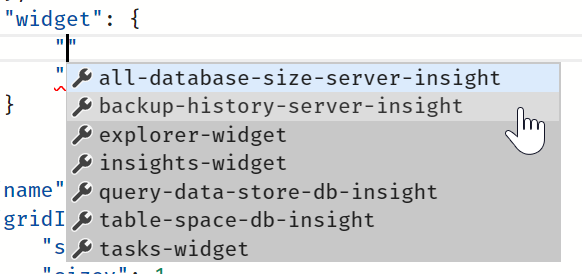
To try out these visualizations, let’s add a custom widget for table space and row size.
{
     "name": "Large Tables",
     "gridItemConfig": {
         "sizex": 2,
         "sizey": 1
     },
     "widget": {
         "table-space-db-insight": null
     }
},
That’s it. This particular quick visualization doesn’t take any additional properties and after a quick refresh of the dashboard, you’ll see the tables taking up the most space and pertinent information.
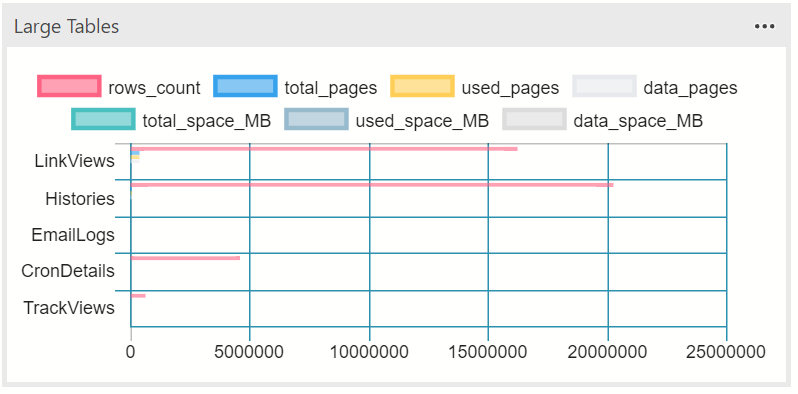
As expected from this system (one of our development databases), the histories transaction log, cron task details, and link views (from our link shortener) part of the largest. Thankfully, the error log isn’t in the mix. =]
For me, the table size and backup history widgets are vital dashboard widgets.
Key points to remember:
- Quick visualizations don’t require an external SQL file.
- Quick visualizations lack any customization (however, you can ‘Run Query’ from the menu to see the query, change it, and build your own.)
Now that we’ve looked at basic system reporting, let’s try it out using custom data from the database.
Building a custom database metric widget
Now that we’ve tried out the built-in quick visualization widgets, let’s try to make our own to output the top 10 fragmented indexes in our database.
SELECT TOP 10
   [objs].[name] + '.' + ISNULL([idx].[name], 'N/A') AS [IndexName],
   CAST([phystats].[avg_fragmentation_in_percent] AS NUMERIC(5,2)) AS [AvgFragmentationPercent]
FROM
   [sys].[indexes] AS [idx]
   INNER JOIN [sys].[objects] AS [objs]
      ON [idx].[object_id] = [objs].[object_id]
   LEFT JOIN  [sys].[partitions] AS [partitions]
      ON [idx].[object_id] = [partitions].[object_id]
      AND [idx].[index_id] = [partitions].[index_id]
   LEFT JOIN (
            SELECT
               [idx].[object_id]
               , [idx].[index_id]
               , SUM([sAU].[used_pages]) * 8 AS [IndexSizeInKB]
            FROM
               [sys].[indexes] AS [idx]
               INNER JOIN [sys].[partitions] AS [partitions]
                  ON [idx].[object_id] = [partitions].[object_id]
                  AND [idx].[index_id] = [partitions].[index_id]
               INNER JOIN [sys].[allocation_units] AS [sAU]
                  ON [partitions].[partition_id] = [sAU].[container_id]
            GROUP BY [idx].[object_id], [idx].[index_id]
   ) [IdxSizeDetails]
      ON [idx].[object_id] = [IdxSizeDetails].[object_id]
      AND [idx].[index_id] = [IdxSizeDetails].[index_id]
   LEFT JOIN [sys].[dm_db_index_physical_stats] (DB_ID(),NULL,NULL,NULL,'LIMITED') [phystats]
      ON [idx].[object_id] = [phystats].[object_id]
      AND [idx].[index_id] = [phystats].[index_id]
      AND [phystats].[database_id] = DB_ID()
WHERE
   [objs].[type] IN ('U','V')
   AND [objs].[is_ms_shipped] = 0x0
   AND [idx].[is_disabled] = 0x0
   AND CAST([phystats].[avg_fragmentation_in_percent] AS NUMERIC(5,2)) > 0
ORDER BY CAST([phystats].[avg_fragmentation_in_percent] AS NUMERIC(5,2)) DESC
It’s a bit of a hefty query, but does the job of fetching both table and view indexes, pulling their fragmentation levels, and ordering them from highest fragmented to lowest. Again, saved to our /widgets/list_indexes.sql folder like in part 1.
For our dashboard.database.widgets section, let’s add a new one for this widget.
{
    "name": "Index Fragmentation (Top 10)",
    "gridItemConfig": {
        "sizex": 2,
        "sizey": 1
    },
    "widget": {
        "insights-widget": {
            "queryFile": "e:/dropbox/sql/widgets/list_indexes.sql",
            "type": {
                "horizontalBar": {
                    "legendPosition": "none",
                    "columnsAsLabels": true
                }
            }
        }
    }
}
The widget definition above provides us with:
- a two column wide, 1 column tall widget named ‘Index Fragmentation (Top 10)’
- the query read from the set location in my Dropbox folder
- the widget is an insights widget containing a horizontal bar graph
- the widget will HIDE (
none) the legend - the widget will use column names as labels (for tooltips)
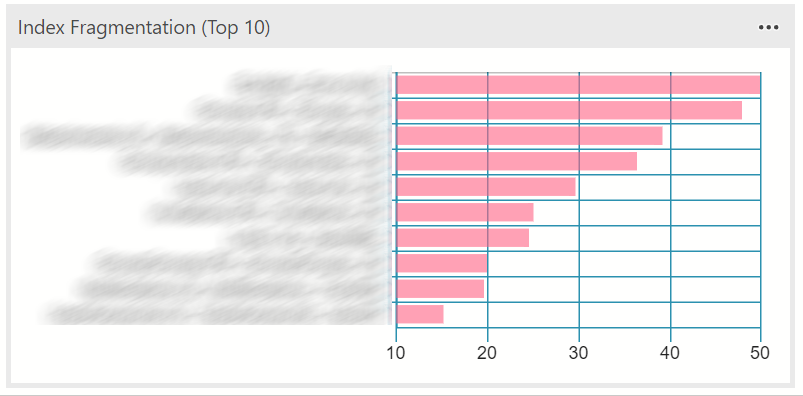
Now I have a quick glance on indexes that need to be rebuilt and/or maintenance plans that may not be running as expected.
Building a widget for data driven KPIs
In this example, let’s say we want to track user signups by month. The SQL server isn’t the most common place to see it, but it’s a good example to see what user data looks like inside of a widget.
SELECT
  [Signup Date] = CAST(DATEADD(MONTH,DATEDIFF(MONTH,0,DateCreated), 0) as DATE),
  Signups = COUNT(Id)
FROM
  Users
GROUP BY
  DATEADD(MONTH,DATEDIFF(MONTH,0,DateCreated), 0)
ORDER BY
  [Signup Date]
To simplify things, the query groups each count of signups by the date created into tidy monthly buckets. I choose to keep everything as “first of the month” buckets, but you could simply reduce it to a string value as well.
As before, the queries to power widgets go in an external SQL file. For this one, let’s name it /widgets/user_signups_by_month.sql and place it in the same location as before in part 1.
Once your SQL file is in it’s place, open your User Settings and let’s add a new entry into dashboard.database.widgets.
{
    "name": "User Signups By Month",
    "gridItemConfig": {
        "sizex": 2,
        "sizey": 1
    },
    "widget": {
        "insights-widget": {
            "queryFile": "e:/dropbox/sql/widgets/user_signups_by_month.sql",
            "type": {
                "line": {
                    "legendPosition": "none",
                    "columnsAsLabels": true
                }
            }
        }
    }
}
The widget definition above provides us with:
- a two column wide, 1 column tall widget named ‘User Signups By Month’
- the query read from the set location in my Dropbox folder
- the widget is an insights widget containing a line graph
- the widget will HIDE (
none) the legend (as there’s only one series, it’s fluff) - the widget will use column names as labels (for tooltips)
Right-click your server and click Manage to refresh (or open), your database dashboard and the new widget appears.
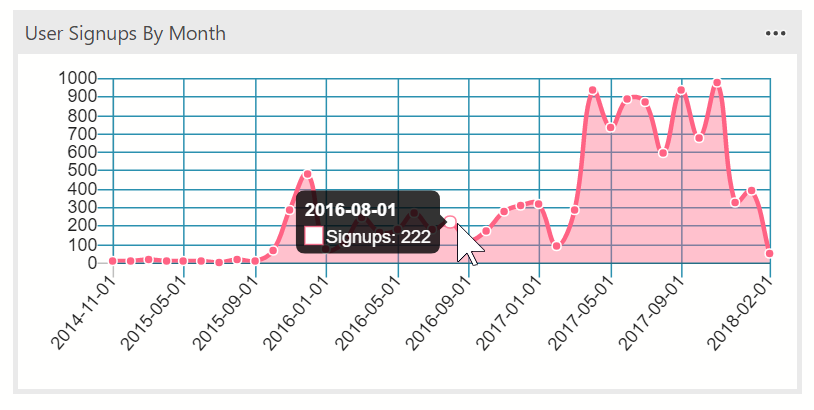
This is just an example using data from the database’s user tables; you can customize it to meet your own needs.
Summary
There’s nearly endless possibilities with custom widgets whether it be to track database performance data, server metrics, or custom KPIs for your business or segment–right on the dashboard.
Have a great idea for a custom widget? Leave it in the comments below with a link to a gist to share with everyone!